File:Himmelblau no2.JPG
Jump to navigation
Jump to search
Size of this preview: 800 × 444 pixels. Other resolutions: 320 × 178 pixels | 640 × 356 pixels | 900 × 500 pixels.
Original file (900 × 500 pixels, file size: 80 KB, MIME type: image/jpeg)
Summary
| Description |
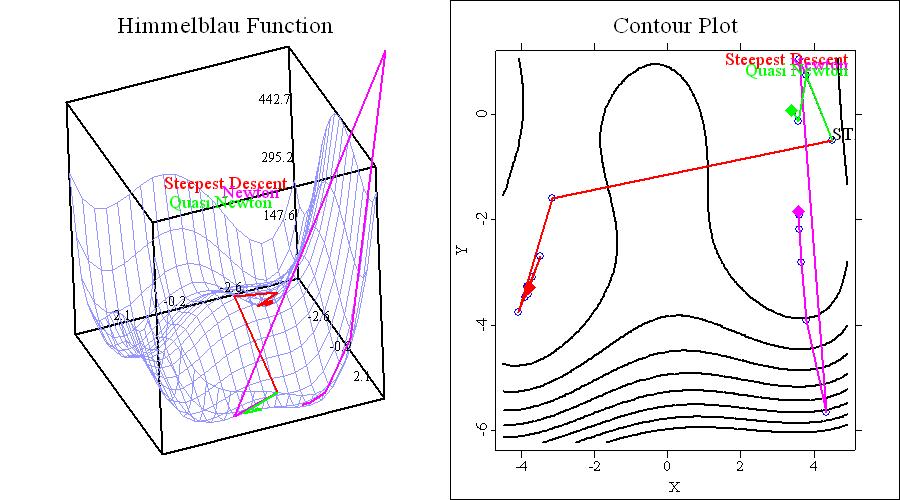
The picture was created by me using the statistical software XploRe. The picture displays a contour plot and a 3D plot for three numerical optimization algorithms for the so-called Himmelblau function. |
||
| Date | 18 January 2006 (original upload date) | ||
| Source | No machine-readable source provided. Own work assumed (based on copyright claims). | ||
| Author | No machine-readable author provided. Michael.edna~commonswiki assumed (based on copyright claims). | ||
| Other versions |
|


Licensing
| I, the copyright holder of this work, release this work into the public domain. This applies worldwide. In some countries this may not be legally possible; if so: I grant anyone the right to use this work for any purpose, without any conditions, unless such conditions are required by law. |
File history
Click on a date/time to view the file as it appeared at that time.
| Date/Time | Thumbnail | Dimensions | User | Comment | |
|---|---|---|---|---|---|
| current | 19:47, 18 January 2006 | | 900 × 500 (80 KB) | wikimediacommons>Michael.edna~commonswiki | The picture was created by me using the statistical software XploRe. The picture displays a contour plot and a 3D plot for three numerical optimization algorithms for the so-called Himmelblau function. |
File usage
The following page uses this file: