File:Pi 30K.gif
Jump to navigation
Jump to search
No higher resolution available.
Pi_30K.gif (500 × 500 pixels, file size: 476 KB, MIME type: image/gif, looped, 10 frames, 2.0 s)
Summary
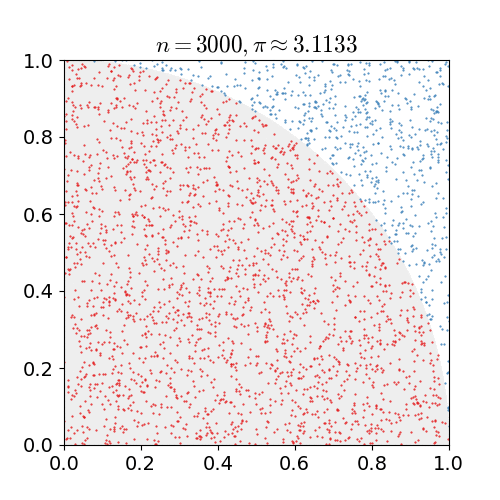
| Description |
English: As points are randomly scattered inside the unit square, some fall within the unit circle. The fraction of points inside the circle over all points approaches pi/4 as the number of points goes toward infinity. This animation represents this method of computing pi out to 30,000 iterations.
Português: Conforme os pontos são espalhados aleatoriamente no quadrado unitário, alguns caem dentro do círculo unitário. A fração de pontos dentro do círculo sobre todos os pontos se aproxima de pi/4 à medida que o número de pontos tende ao infinito. Essa animação representa esse método de cálculo de pi até 30 000 iterações. |
| Source | Own work |
| Author | nicoguaro |
| Source code | Python codefrom __future__ import division
import numpy as np
import matplotlib.pyplot as plt
import matplotlib.patches as mpatches
import matplotlib.animation as animation
from matplotlib import rcParams
# In Windows the next line should provide the full path to convert.exe
# since convert is a Windows command
#rcParams['animation.convert_path'] = "C:\Program Files\ImageMagick-6.9.3\convert.exe"
rcParams['mathtext.fontset'] = 'cm'
rcParams['font.size'] = 14
red = "#e41a1c"
blue = "#377eb8"
gray = "#eeeeee"
def update(n):
ax.cla()
pts = np.random.uniform(low=0, high=1, size=(2, n))
circ = pts[:, pts[0, :]**2 + pts[1, :]**2 <= 1]
out_circ = pts[:, pts[0, :]**2 + pts[1, :]**2 > 1]
pi_approx = 4*circ.shape[1]/n
circle = mpatches.Wedge((0, 0), 1, 0, 90, color=gray)
ax.add_artist(circle)
plt.plot(circ[0, :], circ[1, :], marker='.', markersize=1,
linewidth=0, color=red)
plt.plot(out_circ[0, :], out_circ[1, :], marker='.',markersize=1,
linewidth=0, color=blue)
plt.title(r"$n = {}, \pi \approx {:.4f}$".format(n, pi_approx))
plt.axis("square")
plt.xlim(0, 1)
plt.ylim(0, 1)
nvec = np.round(np.logspace(2, 5, 10))
nvec = [3000, 4000, 5000, 6500, 8500, 10000, 15000, 18000, 24000, 30000]
fig = plt.figure(figsize=(5, 5))
ax = fig.add_subplot(111)
ani = animation.FuncAnimation(fig, update, frames=nvec, blit=False)
ani.save("monte_carlo_pi.gif", writer='imagemagick',
savefig_kwargs={'delay': 6})
|
Licensing
I, the copyright holder of this work, hereby publish it under the following license:
This file is licensed under the Creative Commons Attribution 3.0 Unported license.
- You are free:
- to share – to copy, distribute and transmit the work
- to remix – to adapt the work
- Under the following conditions:
- attribution – You must give appropriate credit, provide a link to the license, and indicate if changes were made. You may do so in any reasonable manner, but not in any way that suggests the licensor endorses you or your use.
File history
Click on a date/time to view the file as it appeared at that time.
| Date/Time | Thumbnail | Dimensions | User | Comment | |
|---|---|---|---|---|---|
| current | 17:00, 16 February 2017 | | 500 × 500 (476 KB) | wikimediacommons>Nicoguaro | Make the plot square and increase gif delay. |
File usage
The following page uses this file: